Monitor the statistics of Nginx with Cacti
First, add the next lines to configuration file of nginx
 location /server_status {
    stub_status on;
    access_log off;
    # Only me can access this
    #allow 10.0.0.12;
    #deny all;
 }
Run nginx -t to make sure the configuration file is correct. Then run kill -1 nginx_pid, nginx will reload the configuration. After nginx reload it, try to access the url: http://server/server_status/, the browser will display like this:
 Active connections: 303
 server accepts handled requests
  6314384 6314384 34931986
 Reading: 3 Writing: 5 Waiting: 295
Next, create the script to get the status data from the nginx server. I wrote a python tool to get these data.
It's better that putting this command in <path_cacti>/scripts/
 #!/usr/bin/env /usr/bin/python
 import sys,os,commands
 import re
 import urllib2,urllib
 p = re.compile('\n')
 st = []
 try:
     url = 'http://ttm.clogi.com/my_nginx_status'
     s = urllib.urlopen(url)
     s = s.read()
     s = s.split('\n')
     a = s[0].split(' ')
     if sys.argv[1] == 'actconns':
         print(a[2])
     elif sys.argv[1] == 'requests':
         a = s[2].split(' ')
         print(a[3])
     elif sys.argv[1] == 'rqrw':
         a = s[2].split(' ')
         str = 'request:' + str(float(a[3]) / float(a[1]))
         a = s[3].split(' ')
         str = str + ' read:' + a[1] + ' write:' + a[3]
         print(str)
     else:
         print(0)
 except Exception, err:
     print(0)
Now, login cacti, to setup the new graph.
Click Data Input Methods, add a new data input method


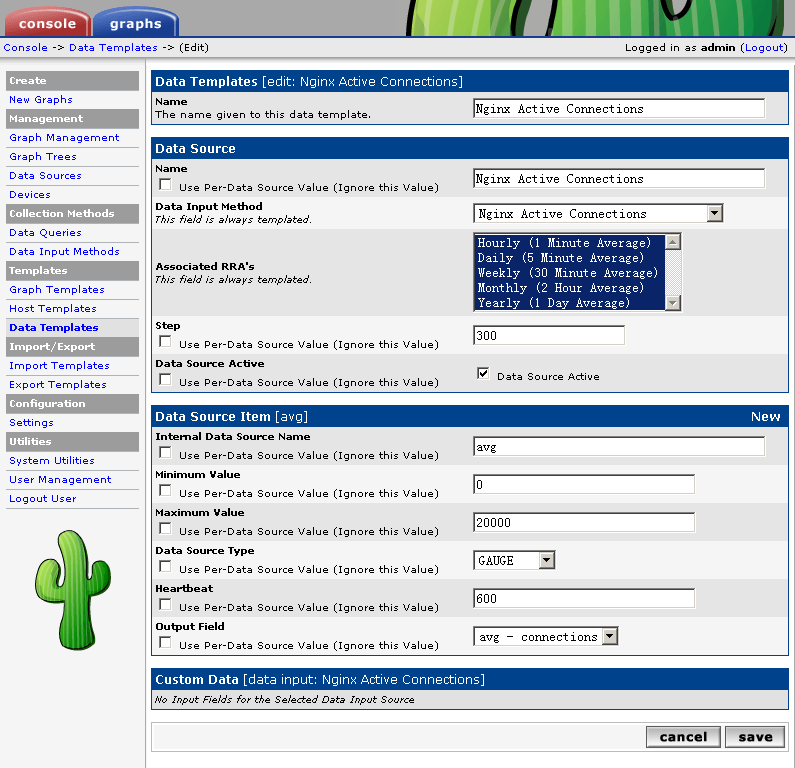
Then create Data Templates


Ok, let create Graph Templates

That' OK!